Tuist

Tuist

変更履歴

Product

macOS runner profiles have offered a single machine shape since launch: 6 vCPU / 14 GB. There is now a second, 12 vCPU / 28 GB, running on M4 Pro hardware.

Pick it when you create or edit a macOS profile. The 6 vCPU shape stays the default, and existing profiles keep the shape they were created with.

Learn more in the runner profiles documentation.

Product

Reliability automations used to measure every run of a test, whichever branch it came from, so uploading pre-commit results meant letting work-in-progress failures move the number that decides whether a test gets quarantined.

They now measure runs on your project's default branch. There is nothing to configure: existing alerts pick it up, and send your pre-commit runs to Tuist to get the reports and failure detail while the reliability figure keeps describing your trunk. A test case needs at least ten default-branch runs in the window before an alert acts on it, so a single bad run cannot quarantine anything.

Flakiness automations are unchanged and still measure every branch.

Product

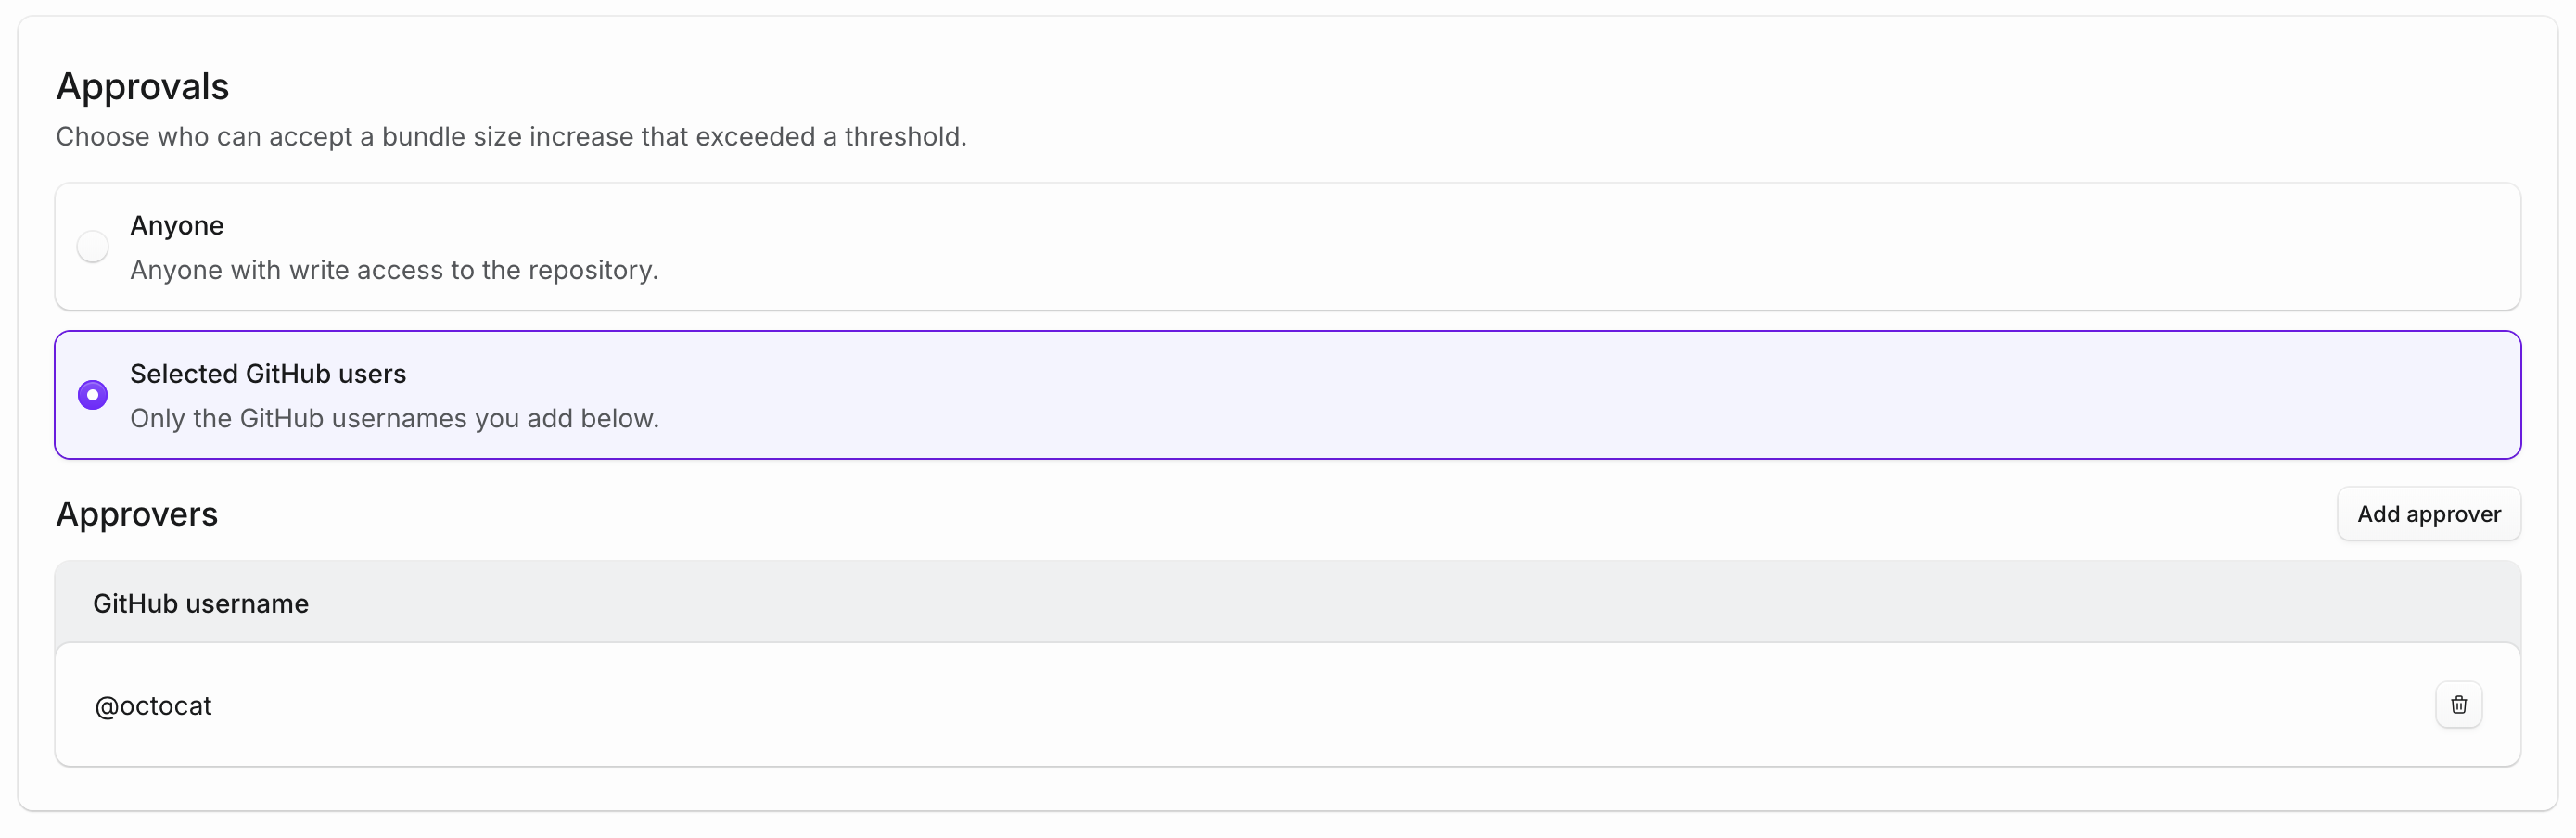
When a pull request pushes your app past a size threshold, Tuist fails the tuist/bundle-size check run and puts an Accept button on it, so an increase you meant to make does not need a second commit to get through. Until now anyone with write access to the repository could press it, which is a wide door for a check whose job is to stop the merge.

Settings > Bundles now carries an Approvals policy.

The Approvals section of a project's bundle settings, with the policy set to selected GitHub users and one approver listed

Learn more in the bundle size documentation.

Product

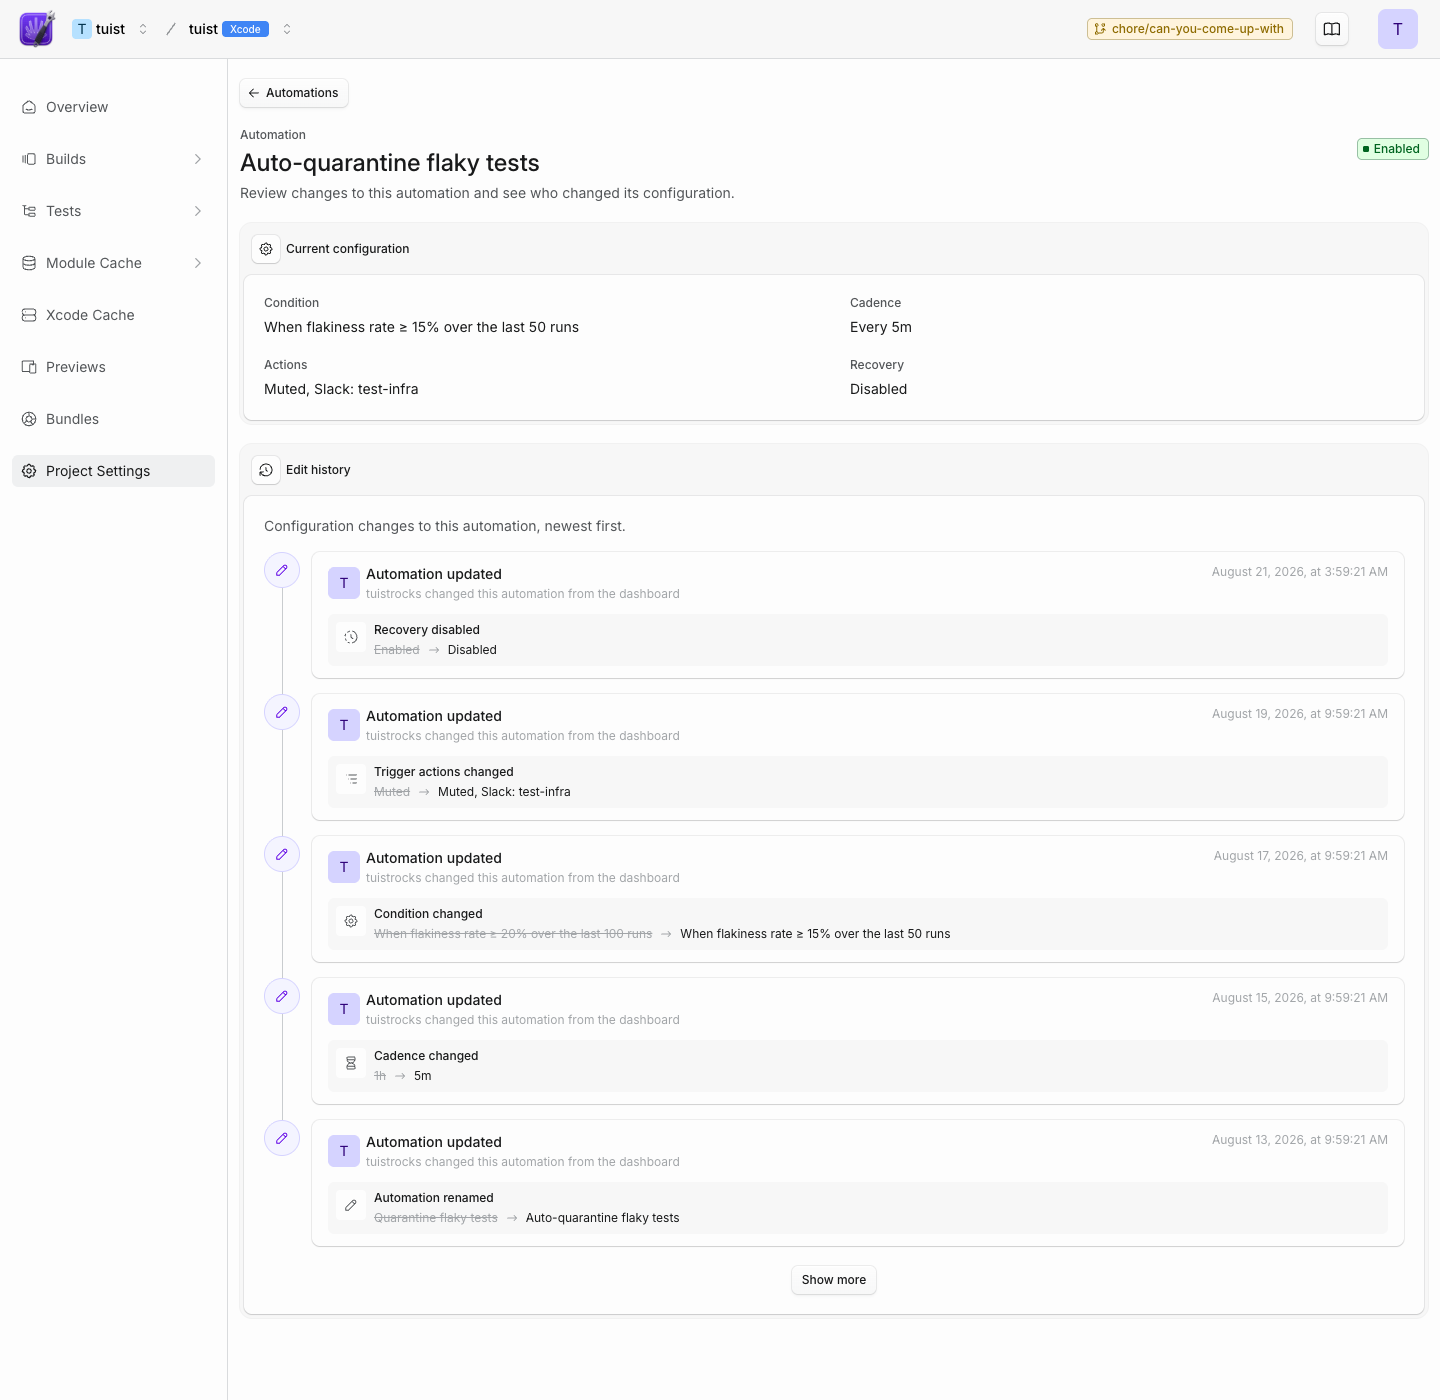
Project automation settings now include a configuration history. Each entry shows who made the change, when it happened, the fields that changed, and the previous and new values.

The latest five changes are shown first, with Show more available when an automation has older history. This makes it easier to understand why an automation behaves differently while keeping long histories readable.

Automation configuration history with a centered Show more button

Product

The test case page reported four numbers for the window you picked: how many times the test ran, how often it flaked, how reliable it was, and how long it took. Each one told you where the test stands. None of them told you how it got there, which is the part you act on. A test at 93% reliability is a different problem depending on whether it has been at 93% all month or fell there on Tuesday.

Every metric is now a chart. Click one and the card draws it across the period, next to what it was over the window before.
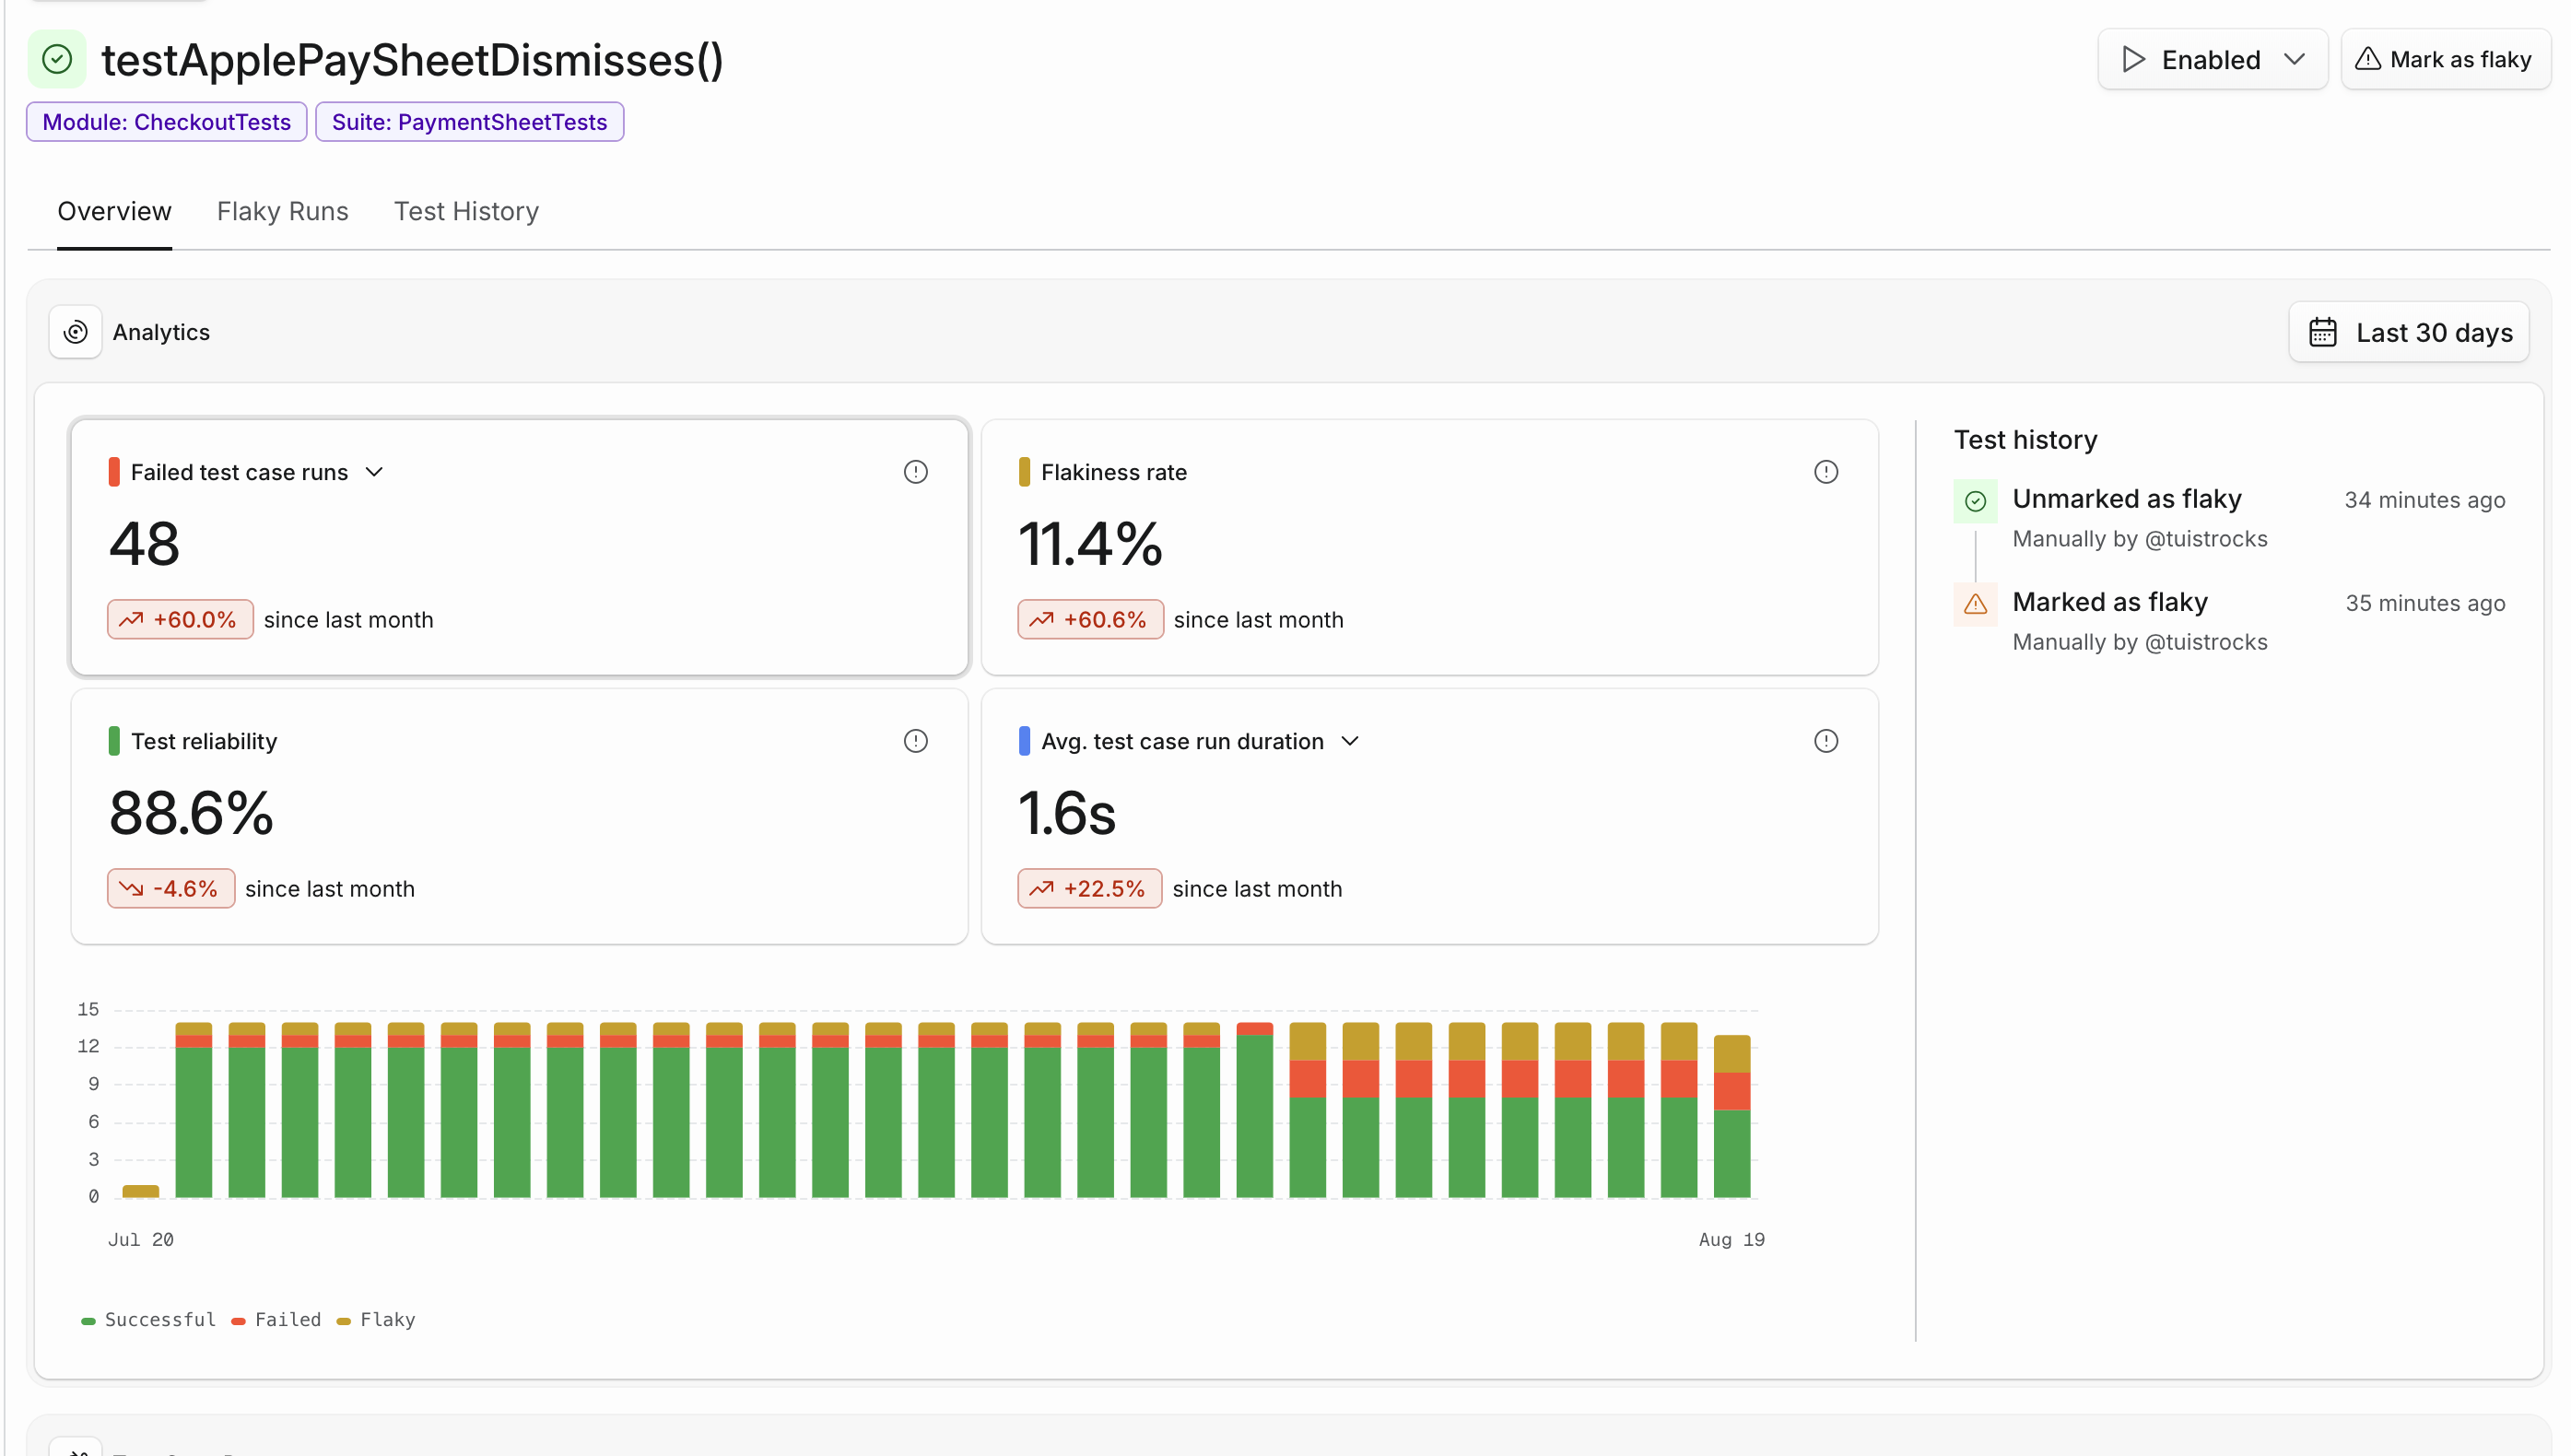
Analytics for a single test case in the Tuist dashboard: run outcomes stacked per day, each metric carrying its trend, and the test's history beside them

Runs is one bar per day, split by how those runs came out: successful, failed, flaky, quarantined, skipped. The height is the number of runs and the composition is the story. In the run above, three weeks of green give way to red and yellow bands nine days in, which is a regression with a date on it rather than a reliability number that drifted. The widget counts all runs, or just the failed or flaky ones, from a dropdown on its title.

Flakiness rate and reliability are drawn against a fixed 0-100% axis, so a test that sat between 98% and 100% all month reads as steady rather than as a cliff.

Duration draws the average with p50, p90 and p99 together. Reading them side by side separates a test that got slower for everyone from one that is usually fast and occasionally stalls: when the p50 climbs, the test itself changed; when only the p99 climbs, something intermittent did.

The test's own history runs down the side of the card, so a state change and the chart it explains are read together. The day someone quarantined a test sits beside the bars where its failures stopped counting.

Charts follow the date range picker, bucketing by hour, day or month to match the window. Days the test case did not run are gaps in the duration and rate lines rather than a test that suddenly took no time or failed every run, and a period with no runs at all says so instead of drawing a flat line at zero. A window with nothing before it is not a baseline either, so a test case that only started running this week shows no trend rather than a change of nothing.

Product

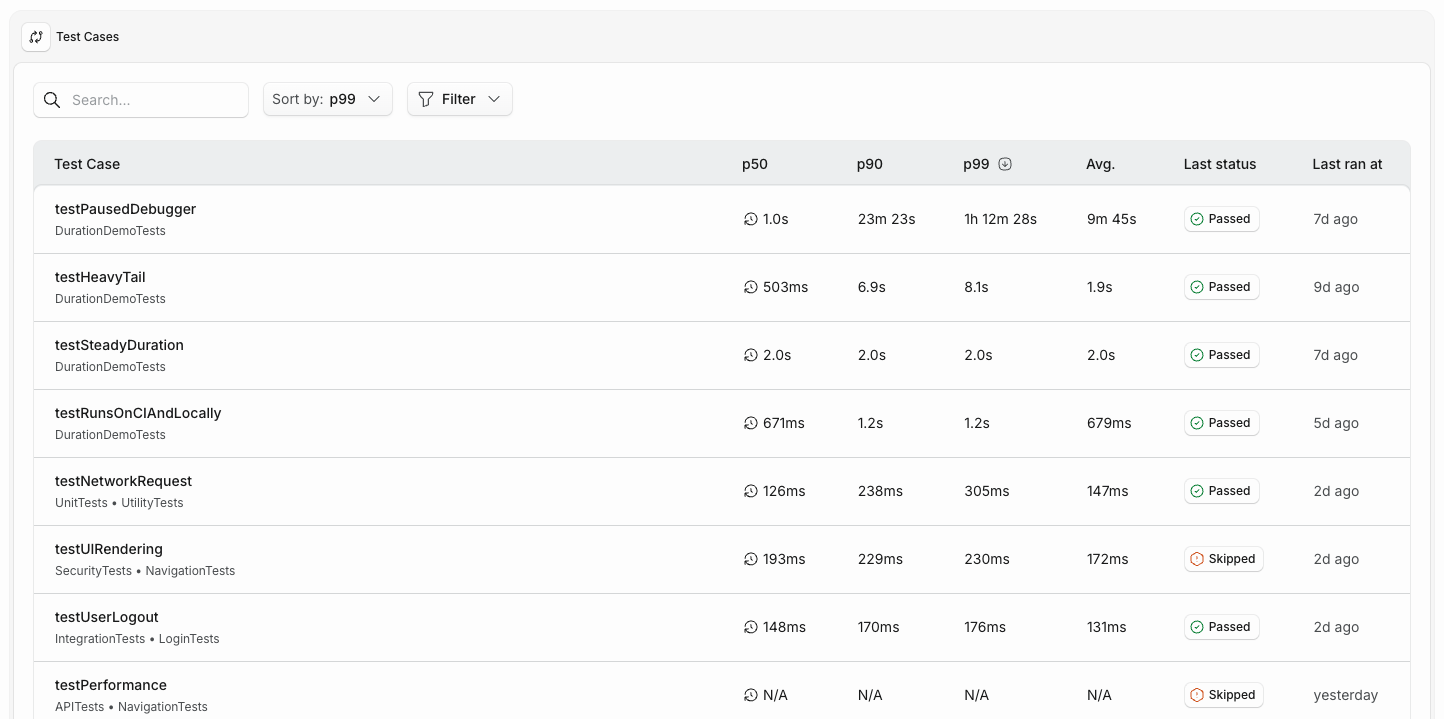
The Test Cases table showed one duration per test: the mean of its last 50 runs, with no time bound and no separation between CI and local. A single stalled run, a paused debugger for example, stayed in that average until 50 newer runs pushed it out, and could put a test that usually finishes in a second at the top of your slowest list.

It now shows p50, p90, p99 and the average side by side, over the runs from the last 14 days and scoped to the environment you select. Reading them together tells you something no single number does: a test whose p50 and p99 match takes the same time every run, while one whose p99 towers over its p50 is usually fast and occasionally not. Each column sorts on its own statistic, so "slowest by median" and "worst tail" are two orderings of the same table.

A test case needs at least five runs inside the window before its durations are ranked. Below that the cells read N/A, so a test with a single recorded run no longer sorts to the top on that one sample.

Test Cases table in the Tuist dashboard with p50, p90, p99 and average duration columns, sorted by p99

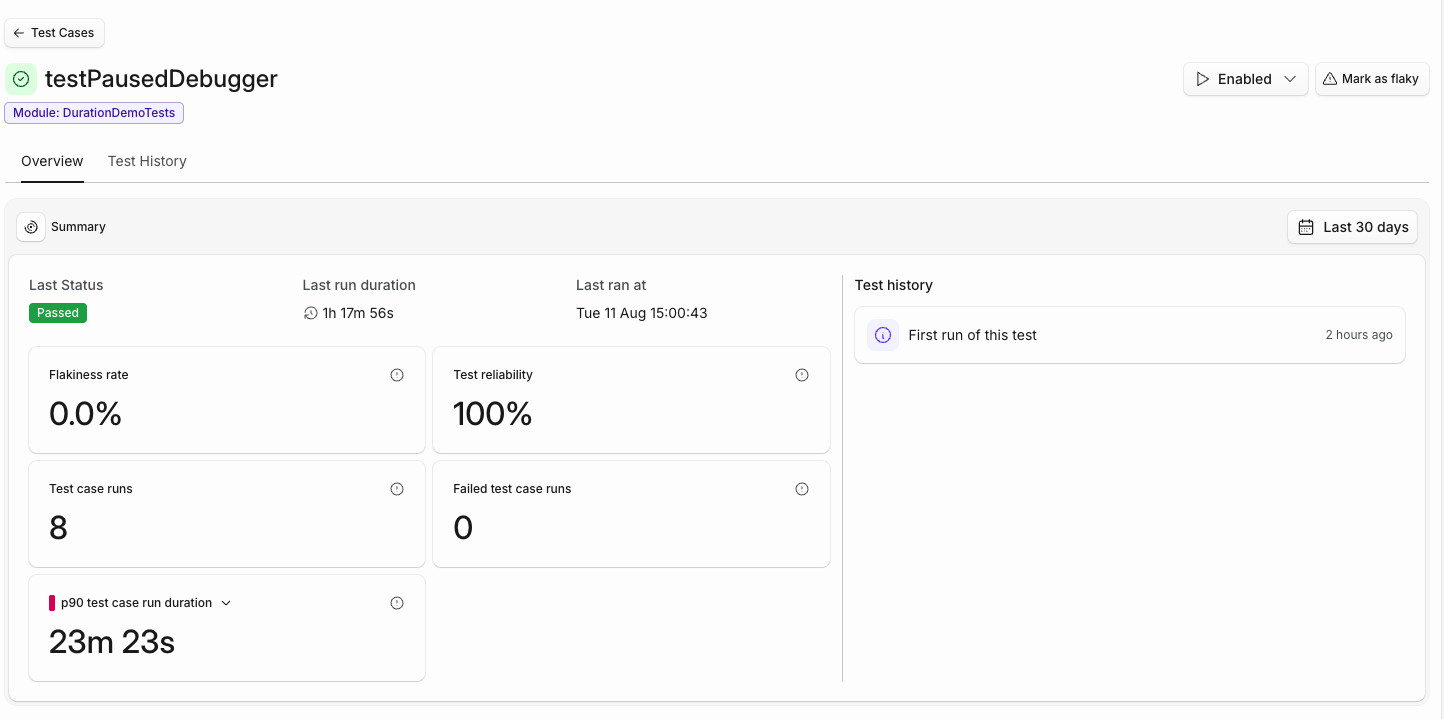
The same statistics are on the test case page, where the duration summary has a dropdown to switch between them.

Summary metrics for a single test case, showing the p90 run duration selected from a dropdown

Product

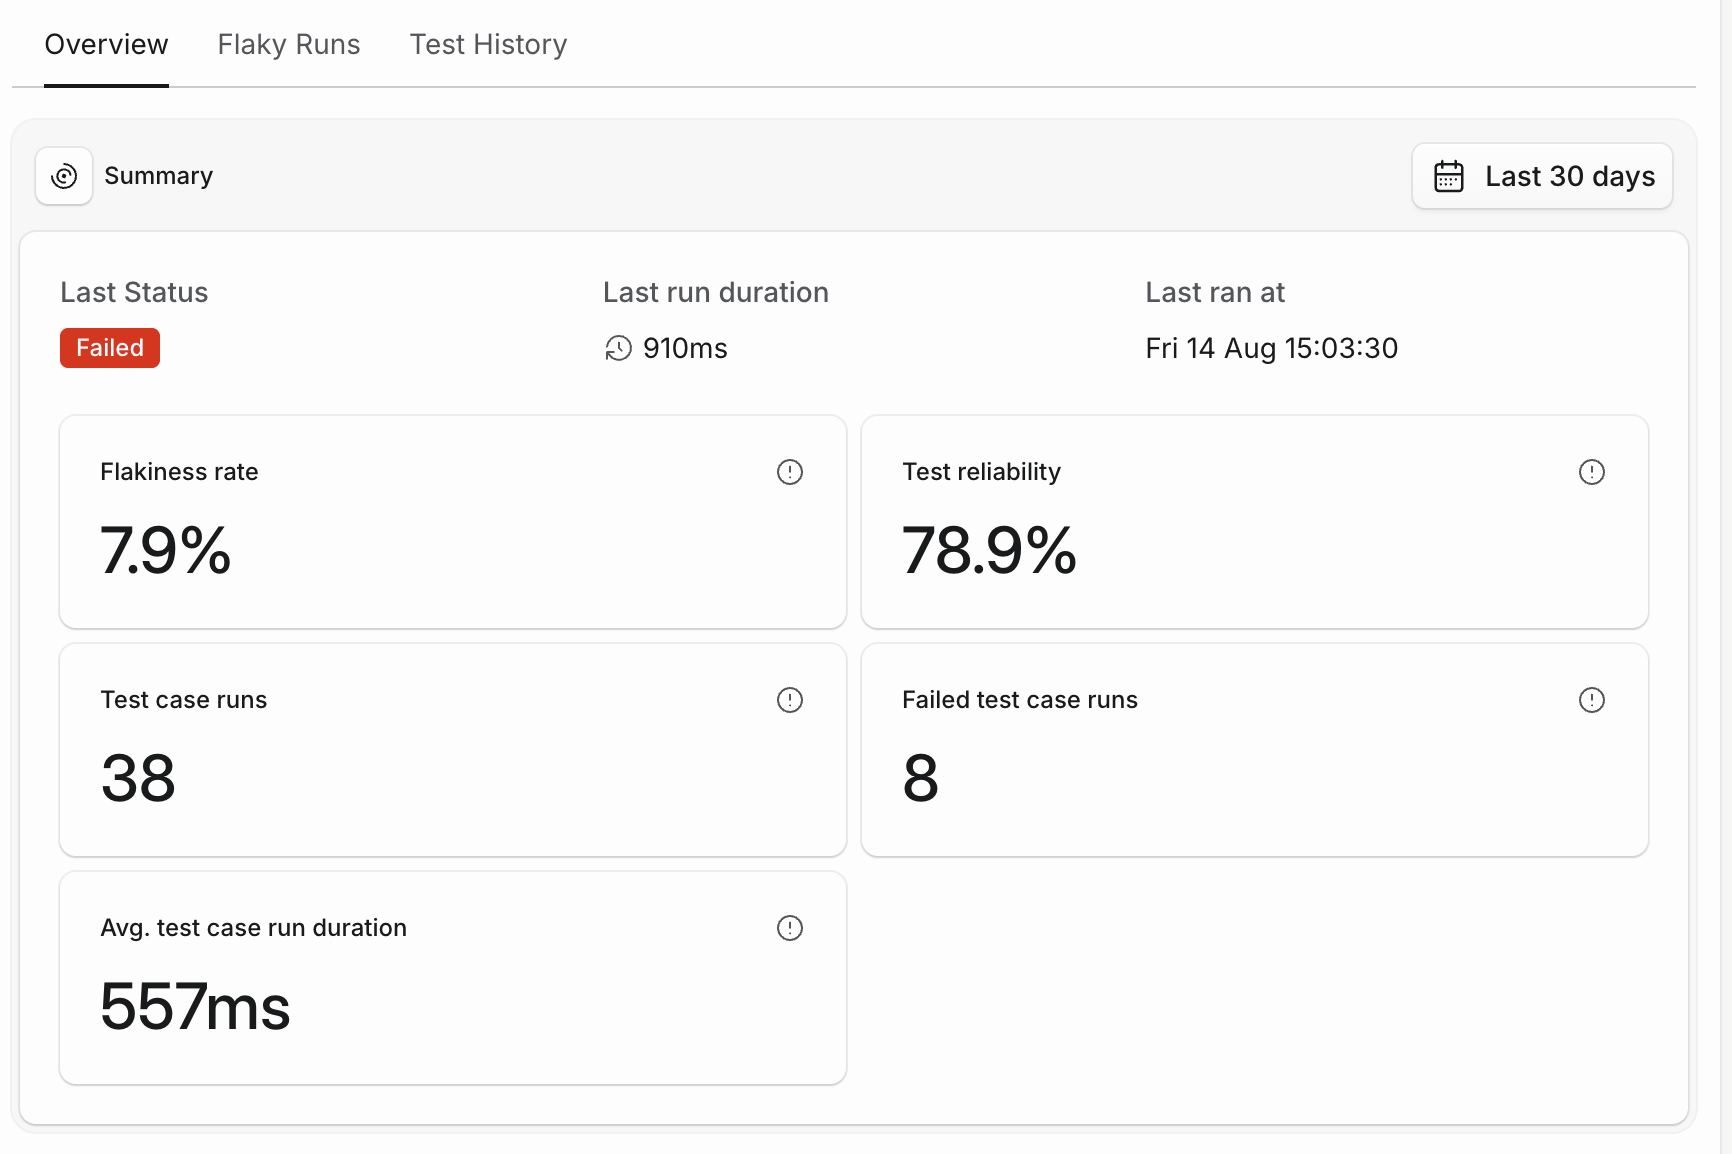
The summary metrics on a test case page now respond to a date range picker, with presets for the last 24 hours, 7 days, 30 days and 12 months, plus a custom range. The selection lives in the URL, so a link to a test case carries the window you were looking at.

Narrowing the window surfaces a test that has passed for months and started failing this week, which a longer average is slow to reflect.

Summary metrics for a test case in the Tuist dashboard, scoped to the last 30 days with a date range picker

Product

The quarantined tests page now shows a sortable "Quarantined at" column, and the flaky tests page a "Marked flaky at" column. Both timestamps come from the test's event history and reflect when the test entered its current state — re-quarantining a test starts a new period, and the timestamp always describes the same event as the "Quarantined by" attribution next to it.

Sorting by these columns lets you review the lists chronologically: surface the tests that have been parked the longest and are overdue for a fix, or check what was quarantined most recently and why.

Product

A target's output can depend on more than its source files and declared dependencies. Code-generation templates, tool versions, configuration files, and environment variables can all change the resulting binary without previously changing Tuist's target hash. This could cause Tuist to reuse a stale cached artifact.

Targets can now declare these values through additionalHashingInputs:

swift
let hashingInputs: [Target.HashingInput] = [
    .glob("Templates/Model.stencil"),
    .glob("Codegen"),
    .glob("Config/**/*.json"),
    .environmentVariable("FEATURE_CONFIGURATION"),
    .string("generator-v2"),
    .script("codegen --version"),
]

Pass the array to Target.target(additionalHashingInputs:). Exact files, directories, and glob patterns contribute their contents. Environment variables contribute their current value, strings contribute their literal value, and scripts contribute their standard output. When any declared input changes, the target hash changes and Tuist rebuilds the artifact instead of restoring stale cached output.

OSS

Noora is now available as standards-based web components. They share the design tokens, visual language, and component behavior used by Noora’s Phoenix LiveView components, while remaining usable from plain Hypertext Markup Language or any browser framework.

Install @tuist/noora from the Node Package Manager package registry, then import the design tokens and component registration bundle once in your browser entry point:

javascript
import "@tuist/noora/tokens.css";
import "@tuist/noora/web-components";

For a quick browser-only prototype, a content delivery network such as jsDelivr can serve the same published files directly from the Node Package Manager package:

html
<link
  rel="stylesheet"
  href="https://cdn.jsdelivr.net/npm/@tuist/noora@latest/priv/static/tokens.css"
/>
<script
  type="module"
  src="https://cdn.jsdelivr.net/npm/@tuist/noora@latest/priv/static/noora-web-components.js"
></script>

The @latest addresses are convenient for prototypes. Pin an exact published version when using Noora in production.

You can then use Noora custom elements directly:

html
<noora-button variant="primary">Create project</noora-button>

Interactive components use standard browser events where they fit and documented noora-* custom events for structured interactions. For example:

javascript
document.querySelector("noora-select").addEventListener("noora-select", (event) => {
  console.log(event.detail.value);
});

The package also includes TypeScript declarations, a Custom Elements Manifest, and generated reference documentation for attributes, properties, slots, styling parts, and events.